- Hits: 10968
Portfolios are often kept very general or are not defined at all and therefore only form a kind of container for projects. Thus it can only be used insufficiently as a means of management and control and it is highly recommended to think in more detail about the purpose of the portfolio.
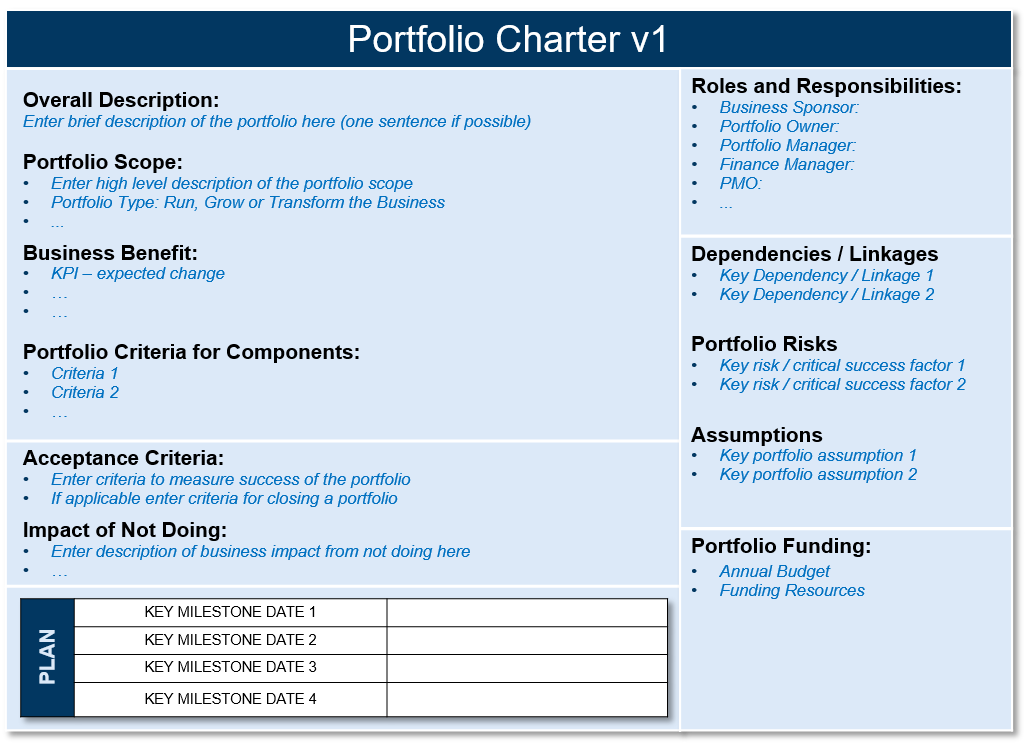
The Portfolio Charter is a helpful tool in this respect:
The following elements are summarized here:
Overall Description
A short, concise description of the portfolio, preferably in one sentence. It should indicate where the portfolio is to be positioned.
Portfolio Scope
Enter here the main points regarding the size and type of the portfolio. Common portfolio types are
- Run the Business: Maintenance of existing applications and infrastructure. This also includes regular growth from business processes.
- Grow the Business: Merger and Acquisition, but also Divestiture. Changes in the organization that go beyond organic growth (positive or negative).
- Transform the Business: Project portfolio that sustainably changes business processes. In addition to innovation, a focus is also placed on productivity.
Business Benefit
Here the various benefits are listed which are to be aachieved by managing the portfolio respectively the associated projects.
Portfolio Criteria for Components
Projects which are financed from the portfolio and thus also managed must meet the right criteria in order to be accepted. This is to prevent dilution.
Acceptance Criteria
Portfolios may be defined for a limited period of time and closed again if certain target criteria are met. These criteria can be specified here. In addition to the acceptance criteria, specific termination criteria can also be listed in order to prevent the portfolio from being continued although the objectives can no longer be achieved. In the case of unlimited portfolios, such as Lifecycle, this section can of course be left empty.
Impact of not doing
Description of the consequences if this portfolio is not executed. The decision-makers must know what it means if the proposed portfolio is rejected.
Milestones
Under certain circumstances it makes sense to define intermediate targets for the portfolio, similar to a program. If necessary, these can be entered here, otherwise this part is left empty.
Roles and Responsibilities
Description of the most important stakeholders in the portfolio
- Business Sponsor: For portfolios related to business, a sponsor from the relevant area should be nominated.
- Portfolio Owner: Owner of the portfolio who belongs to the business or technical department (e.g. IT). Owner and sponsor can possibly be the same person, for example if it is a purely technical portfolio.
- Portfolio Manager: takes over the operational portfolio tasks and ensures communication with the strategic portfolio management.
- Finance: Ensures financial processes and information flow
- PMO: If available, representative of the Project Management Office.
In addition, other important roles can of course be added.
Dependencies / Linkages
Like projects/programs, portfolios can also depend on other factors. For example, certain technologies. It is important to recognize them otherwise the portfolio cannot be executed successfully.
Portfolio Risks
The focus here is not on risks relating to individual projects. These are described in the corresponding risk registers. Portfolio risks are those which affect the entire portfolio either from outside or within, such as cluster risks (risks which affect many or even all projects and represent a major hazard when they occur).
Assumptions
Portfolios - such as projects - are also based on certain assumptions. These should also be listed in the charter.
Portfolio Funding
Finally, the funding of the portfolio has to be secured and therefore it is defined where the capital comes from and how much should be invested per year or quarter. These can be absolute or relative figures, for example in relation to turnover.
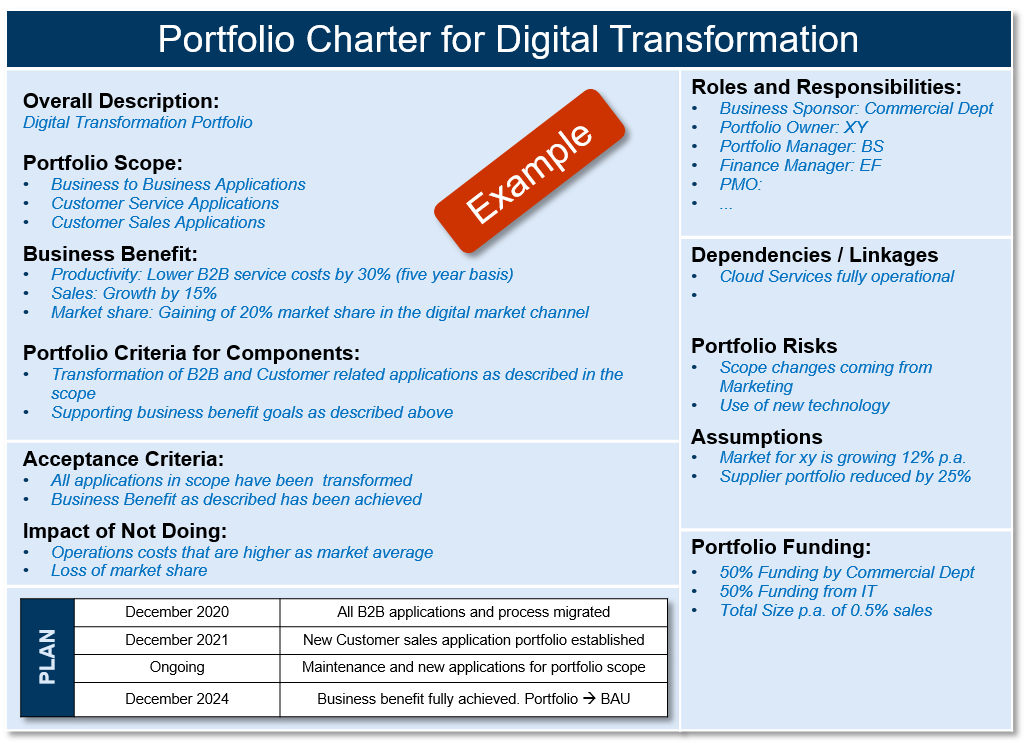
Below is a simple example of a portfolio charter:
- Hits: 6123
The main purpose of good portfolio management is to put the right and scarce resources into key initiatives and projects in order to maximize the return on investment for the company. It is essential that the top management is clear about the objectives.
Without defining and measuring the benefits, it is not possible to manage a portfolio!
While maximizing value is obvious, implementing good portfolio management practices to achieve this goal is often a long and difficult road to take for a variety of reasons. First and foremost, top management must stand behind the portfolio management approach. Without this support it will not work. Another point is that the target criteria at different levels are not the same and people therefore talk at cross purposes and set different priorities.
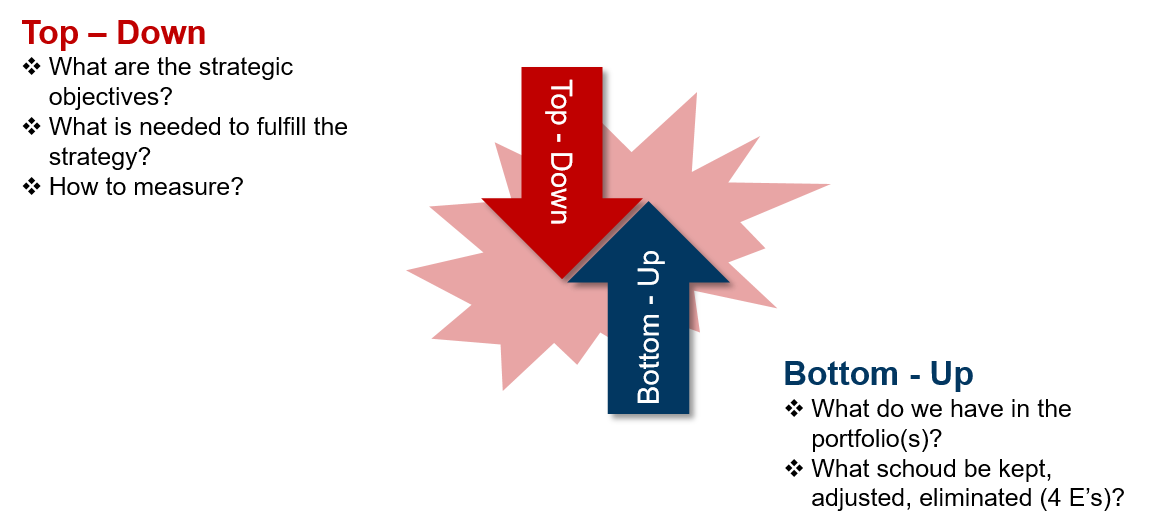
Top management is responsible for defining strategic goals rather than how to achieve them. This is the task of the operational portfolio management, which translates the objectives into concrete projects and implements them. However, the strategic level needs to know what the executing organization needs and, if anything, what prevents it from doing so.
At the executing level, the focus is on the real world, where requirements for new projects also arise, such as life-cycle management, organizational growth or technological progress (road maps). The problem now is that this bottom-up input does not necessarily have to be compatible with the top-down requirements, which is not unusual, as the top management should drive the organization forward and not worry about the status quo. It is also important for the top management to understand that there is also this reality which can limit the agility of the management as certain resources are tied up.
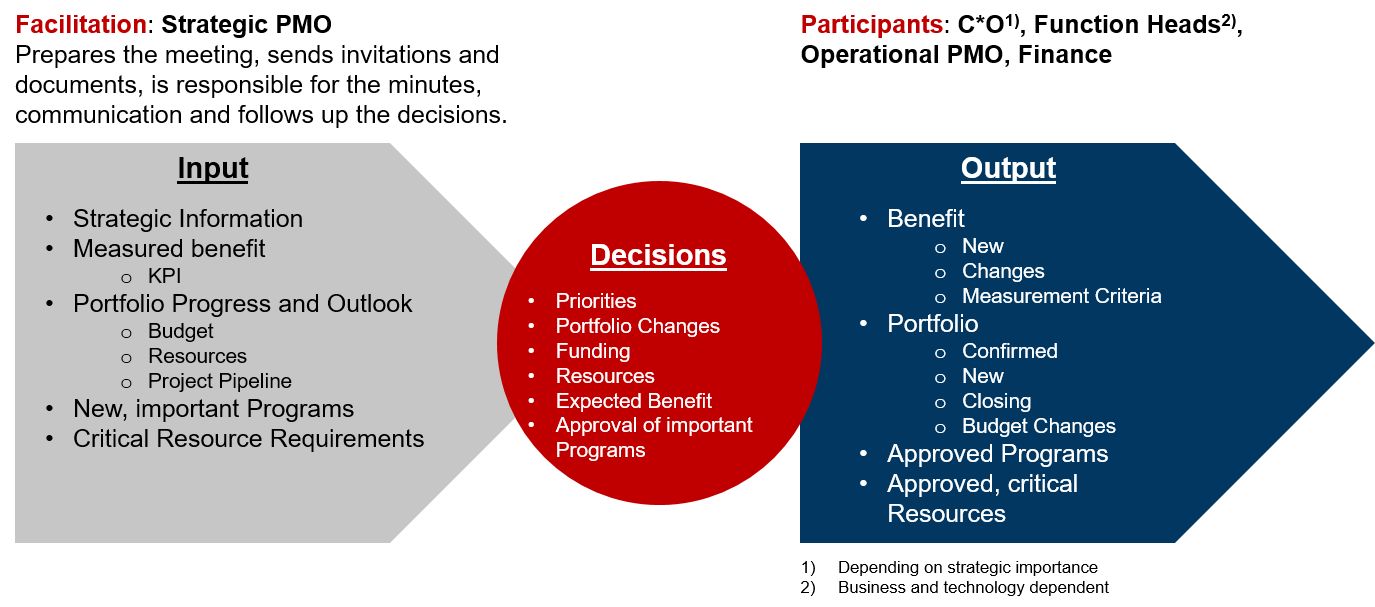
The key here is structured communication between the strategic and operational levels, which is ensured and regulated by the Strategic Portfolio Board (SPB). The SPB is a meeting structure that provides top management with a complete picture by initially providing appropriate, aggregated feedback from the operational environment and supplementing it with relevant information from the strategic area.
Large new programs, which can make a significant contribution to success / failure, are also brought directly to the decision here and not left to the Operational PMO.
This information, which of course was distributed in advance, is intended to answer the following questions
- Are we still on the right track?
- Does the speed fit or are there obstacles that have to be cleared out of the way?
- Do we see the expected changes in the organization and/or in the market?
- What is our scope?
- Does the strategy need to be adjusted or new priorities set?
The figure below provides an overview of the Strategic Portfolio Board.
The Board decides on portfolio adjustments. This can mean that new portfolios are defined or existing ones closed or changed in alignment.
In addition to these points, the management must also make decisions about new projects if they exceed a certain order of magnitude (funds, resources). This is necessary because major projects must also be supported by management. The portfolio management must clearly show the effects in terms of committed resources, but also the benefits of the project. It is advantageous that the business sponsor presents the project itself and the portfolio manager refers to the feasibility of the project in terms of financing, staffing and dependencies.
The decisions made in the SPB have great implications, which is why it is essential that management puts the company's goals above its own objectives and agendas. The processes used must be transparent and the decision-making criteria must be the same for every member.
The output of the Strategic Portfolio Board is adjustments to the expected benefits, which may change over time. This board also sets new priorities, decides on portfolio changes and approves important programs.
Governance plays an important role here, so the portfolio manager must have a certain seniority because he/she must ensure that the processes and rules are followed and that the information and data required are of high quality.
The necessary changes within the organization can be broken down into groups of people (individuals), processes and data. The left side represents a rather low maturity level (usually also the starting position) while the right side lists the factors that characterize a high degree of maturity.
The SPB's decisions are then communicated to the operative portfolio management, which takes over the parameters in its own operative portfolio planning and - very importantly - supports as well.
- Hits: 6220
This phase determines the orientation of the portfolio at the strategic level. The focus is not on projects, but on portfolios that serve a defined purpose and have clear goals and KPIs. Management should consider how important certain strategic goals are to them and what percentage of the total project budget should be allocated to these goals. This process is also known as pitching.
The strategic portfolio management does not belong to the core PMO which is operational and not strategically oriented.
The strategic level of the portfolio management corresponds to the "Act" step in the Deming circle, because - according to definition - the management evaluates the actual state and defines new goals or changes existing ones.
As output of this process, which should take place at least once a year, we see
- Confirmed, existing portfolios with possibly adjusted targets
- New portfolios due to new challenges, e.g. due to digitization
- Closed portfolios, because no increase in value is possible anymore or the portfolio has become obsolete due to changed market conditions.
- Distribution of the total budget among the portfolios
This output defines the framework conditions for operational portfolio management, which deals with the implementation of the portfolio strategy.
- Hits: 110
The first of PMI's five knowledge areas of portfolio management is the Strategic Management of the portfolio and this for good reasons. Without the highlevel input it is impossible to create the portfolio management plan and without a plan, well it is clear that all the activities within the portfolio management are lacking of focus. In the best case the work of the portfolio manager is only inefficient, wasting time on the project request that at the end get no support and disappear in the "hall of never started projects".
In the worst case the portfolio management is seen as only overhead and not delivering a single value to the organization. He or she is then more administrating the portfolio than managing it.
The collection of strategic input will provide the following benefits
- Guidance: A clear vision of what is important to the organization will already reduce the number of new submitted project requests and this avoids that unnecessary work is performed on things that doesn't add any value to the portfolio
- Value: The strategy and derived priorities are the basis to evaluate the project requests and pick the best one to become project candidates. The criteria for evaluation must be public, the evaluation process 100% transparent. Otherwise you are loosing
- Measurement: Only having a strategy enables you as portfolio manager to measure the success of your portfolio against the overall roadmap of the organization. Here is the area where you can demonstrade your value that you are delivering to the organization
Important is that the strategy is known so you should ensure that it is included in your portfolio management and your portfolio communication plan.
- Hits: 3571
Earned Value Analysis (EVA) is a powerful instrument for project controlling. The following key figures describe the schedule and cost situation of a project at time point x.
- Planned Value (PVx)
- Actual Costs ( ACx)
- Earned Value (EVx)
By tracking these metrics, a trend analysis can be created that is mainly used in waterfall projects, but is also an interesting progress control tool for agile projects, as we will see later. See below an example of an EVA chart

The starting point for the EVA is the financial estimate of the project scope or the resulting work packages as planned in a Work Breakdown Structure (WBS), for example. The costs are assigned to each of these work packages or tasks. The sum of these costs is called Planned Value (PV) because they represent the value of the work.
During the execution of the project, the work packages or tasks are completed. The earned value (EV) is then determined from the planned value by, for example
- 100% EV if, the whole task is completed (cautious approach)
- 100% EV when the task has been strarted (optimistic view)
- 50% EV at the beginning and 50% at the end of the task (balanced, but with more effort as you need to book twice)
As EV not necessarily is synchronous with PV, two curves result (marked blue and red). In addition, the real costs (actual costs, AC) are also recorded in the project (green line).
With these three values you can determine a lot about the course of the project and calculate the following KPIs. It is important that the figures are compared at the same project time (e.g. end of month).
Schedule variance (SV).
The plan variance (SV) for the time point x is calculated as follows
SVx = EVx - PVx
If the SVx is greater than zero, this means that the project is ahead of schedule, i.e. progress is greater than originally planned. Conversely, a negative SVx means that the project is lagging behind the plan.
Instead of an absolute KPI, you can also use a relative index (Schedule Variance Index, SPI), which represents the scheduling efficiency.
SPIx = EVx / PVx
A value greater than 1 (or 100%) means that the project is ahead of schedule. Below this, you are in a delay. The advantage of this KPI is that it is very suitable for status reporting (e.g. the project is green if the SPIx value is between 95% and 105%). This ensures that all projects in a portfolio follow the same evaluation criteria.
Cost Variance (CV)
The cost variance calculates the difference between the earned value (EVx) and the actual costs (ACx) and shows whether the project is above or below budget.
CVx = EVx – ACx
If this value is less than zero, it means that the project is running over budget, below that more value is delivered at less cost and the project is therefore under budget. Please note that this key figure does not include the planning value in the calculation, but only refers to the facts actually delivered. The percentage of completion in relation to the current costs. In many control systems, the planned costs are compared (forecast), which is also a possibility, but does not include the delivered work. The KPI in this case would be the forecast variance (FVx).
FVx = PVx - ACx
If the costs in an organization are only posted to a project after the goods have been received, this procedure is not as bad as it appears at first glance. It indicates whether the project is above or below budget and whether there may have been misjudgments regarding cost planning, which of course can also have an influence on the expected progress of the project.
However, since the EVx is determined in the Earned Value Analysis anyway, it should also be used.
Analogous to completion efficiency, cost variance also has a relative KPI, the cost efficiency (CPI).
CPIx = EVx / ACx
This KPI measures the value of work done against actual costs. A value greater than 1 indicates cost savings in the project, while a value less than 1 indicates that the project is more expensive than planned. Similarly, you can use the PVx instead of the EVx.
Advantages / Disadvantages
The method has the advantage that the project progress control is based on measurable and objective criteria. This also ensures that projects can be compared with each other in terms of cost and deadline adherence, which is extremely important within a portfolio. Since the KPIs are collected over several periods, it is also possible to provide better forecasts of the end date and costs.
However, the implementation of Earned Value Analysis is extremely laborious. The costs must be planned and booked according to the Work Breakdown Structure (WBS), which often exceeds the possibilities of the booking system (and also the project manager). Contracts with external suppliers often span several tasks and need to be tracked in more detail than is usually the case. For this reason, implementation attempts often fail.
Implementation the Earned Value Analysis for agile projects.
One way of simplifying the method for implementation is not to refer to individual tasks, but to milestones. Milestones often represent the completion of project phases and thus also the work packages contained therein. The planned value of a project phase therefore corresponds to the costs planned for reaching the milestone.
The PV includes all costs between the last and the next milestone. The same applies to the EV, which is considered reached when the milestone is completed. The current costs (AC) should be determinable from the financial system at any time.
However, if only a few milestones have been planned, the EVA becomes too rough and provides little information for project controlling.
The situation is different for agile projects, where every sprint and/or release can be regarded as a milestone. This means for our EVA key figures.
- PV (Sprint) = Project budget (excluding expenses for project initiation and completion) divided by the number of planned sprints.
- EV (Sprint) = PV (Sprint) x Degree of fulfillment (Sprint)
- AC (Sprint) = measured costs in the sprint
The cost efficiency is calculated by comparing the planned sprint costs with the current degree of completion at the end of the sprint (working increment).
Since sprints always last the same duration, the plan deviation must be considered more differentiated. A value below 100% (or 1) means that the team has overestimated itself, a value above this is theoretically not possible, unless the team has decided to take a story point from the back log into the sprint, which is unusual. In practice, however, they will start with a value below 100% and try to approach 100% scheduling efficiency by constantly improving their effort estimates.
Since it is sufficient to record the current costs here at sprint overall level (and not at task level), the EVA for agile projects can therefore be implemented much more easily than for classic waterfall projects.


